The Ohio Development Services Agency has just issued The Ohio Poverty Report, a document outlining research into the numbers behind the reality of low-income Ohioans.
Based largely on US Census Bureau complied and released information and other federal and Ohio agencies, it is designed to explore trends and comparisons for poverty in the Buckeye State’s cities and counties.
General findings of the report include the following, among others:
- An estimated 1,583,000 people in Ohio were poor – that was 14.0 percent of all persons for whom poverty status was determined, and a poverty rate slightly greater than the national rate of 13.4 percent.
- An estimated 290,000, or 9.8 percent, of Ohio families were poor; the corresponding U.S. rate was 9.5 percent (family poverty rates are lower because family members share resources, and not all persons are in families).
- The latest American Community Survey data for sub-state areas show: 47 of Ohio’s 88 counties had poverty rates below the national average of 14.6 percent; 41 were above the average (averages based on the 2013-2017 five-year dataset).
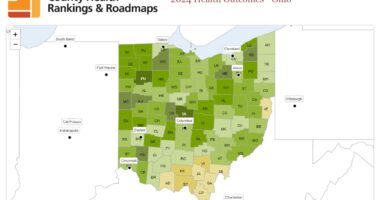
- Delaware County had the lowest rate below the poverty line at 5.1 percent. Warren, Medina and Geauga had the next lowest rates, each at 6.5 percent or lower. All are suburban metropolitan area counties. Athens, Scioto, Adams and Meigs had the highest poverty rates, ranging from 30.2 to 22.5 percent – all are Appalachian (five-year averages).
- 16.2 percent of the people in urban places (densely populated areas of 2,500 or more) were poor, compared with 10.3 percent in rural areas (farms and smaller places); within urban areas, 26.3 percent of those living in the central or principal cites of metropolitan areas were poor, while 10.3 percent of residents of other urban areas were poor (five-year averages of area-type summaries.)
- 13 cities, including seven metropolitan area central cities and four small college towns, had poverty rates at or above Ohio’s metropolitan-area-central-city average of 26.3 percent (five-year averages).
Additional general findings included a comparison of rates for married/unmarried, with/without children, those receiving cash assistance/not receiving, college-educated/not, age groups, seniors, ethnicity, and gender.
Other Delaware County-specific findings and general comments:
- The County had the lowest rate in Ohio for citizens at less than 200 percent of the poverty level.
- While it remains the lowest in the state, there has been an increase in the poverty rate from 3.8 percent in 1999 and 4.5 percent between 2007 and 2011.
- The city of Delaware’s current poverty rate is 9.4 percent. This rate is higher than many other Ohio cities, including Westerville.


